Showing posts with label weather. Show all posts

Monday, January 16, 2023

Pressure prediction analysis

Previously, I analysed how accurate various weather prediction services predicted the temperature a number of days in advance. Today I will look at their predictions for wind speed.

Here is the summary data

Here is a chart of the data for people who prefer visual:


Points to note
  • Openweathermap seems to be the most accurate by far.
  • Yr.no has similar accuracy openweathermap for one day in advance, but when predicting further into the future both darksky and yr.no are similar.
  • The error from openweathermap seems to be much larger than other services. I checked and this error is genuine.

Like the last time, this analysis lumps all cities together for an average result. I might do some analysis later on performance per city.

Sunday, November 10, 2019

Rainfall accuracy

In my previous analysis of forecast accuracy, I didn't look at the prediction for rain. Part of the reason for this is the fact that some of the services don't provide their rainfall reports and/or predictions in an easy to analyse format e.g. it might say 'light drizzle', 'cloudy' or heavy rain.

The one exception to this rule is the yr.no forecast service which provides rainfall predictions and reports in mm/hour. I thought it would be too strict to expect the forecasted mm/hour to match so I instead translated into rain or dry values.

This means that we can have 4 situations:
  1. pred_rain => we predicted rain and we got it
  2. unpred_rain => we didn't predict rain but we got it anyway
  3. pred_dry => we predicted dry weather and we got it
  4. unpred_dry => we didn't predict dry conditions but we got it anyway
I analysed 1 day and 7 day predictions for a selection of cities and I noticed a few key facts:

  • Rain forecasts in Luxor are 100% accurate, but this is because it never rained at all in Luxor during our time to track. This is in stark contrast to the results from other cities I looked at.
  • In Dublin, forecasts are about 82% accurate for the next day and 66% accurate for one week in advance.
  • In Galway, forecasts are about 75% accurate for the next day and 60% accurate for one week in advance. This is only slightly better than random coin tossing which we would expect to  provide 50% accuracy


Here is the raw output if you want to look closer:

1 Days in advance for Dublin
Total 2316
pred_rain 240 10.36%
pred_dry 1662 71.76%
unpred_dry 216 9.33%
unpred_rain 198 8.55%

Correct 1902 82.12%
Incorrect 456 19.69%
 
7 Days in advance for Dublin
Total 2232
pred_rain 84 3.76%
pred_dry 1398 62.63%
unpred_dry 408 18.28%
unpred_rain 342 15.32%

Correct 1482 66.40%
Incorrect 492 22.04%
 
1 Days in advance for Galway
Total 2346
pred_rain 330 14.07%
pred_dry 1422 60.61%
unpred_dry 276 11.76%
unpred_rain 318 13.55%

Correct 1752 74.68%
Incorrect 606 25.83%
 
7 Days in advance for Galway
Total 2256
pred_rain 180 7.98%
pred_dry 1164 51.60%
unpred_dry 474 21.01%
unpred_rain 438 19.41%

Correct 1344 59.57%
Incorrect 654 28.99%
 
1 Days in advance for Luxor
Total 2346
pred_rain 0 0.00%
pred_dry 2346 100.00%
unpred_dry 0 0.00%
unpred_rain 0 0.00%

Correct 2346 100.00%
Incorrect 0 0.00%
 
7 Days in advance for Luxor
Total 2238
pred_rain 0 0.00%
pred_dry 2238 100.00%
unpred_dry 0 0.00%
unpred_rain 0 0.00%

Correct 2238 100.00%
Incorrect 0 0.00%
 
1 Days in advance for Coral Springs
Total 2364
pred_rain 708 29.95%
pred_dry 996 42.13%
unpred_dry 402 17.01%
unpred_rain 258 10.91%

Correct 1704 72.08%
Incorrect 1110 46.95%
 
7 Days in advance for Coral Springs
Total 2268
pred_rain 594 26.19%
pred_dry 846 37.30%
unpred_dry 498 21.96%
unpred_rain 330 14.55%

Correct 1440 63.49%
Incorrect 1092 48.15%
 
1 Days in advance for Perth
Total 2382
pred_rain 168 7.05%
pred_dry 1974 82.87%
unpred_dry 108 4.53%
unpred_rain 132 5.54%

Correct 2142 89.92%
Incorrect 276 11.59%
 
7 Days in advance for Perth
Total 2262
pred_rain 132 5.84%
pred_dry 1740 76.92%
unpred_dry 228 10.08%
unpred_rain 162 7.16%

Correct 1872 82.76%
Incorrect 360 15.92%

Friday, October 4, 2019

Accuracy of temperature predictions

Using the weather data I collected previously, I wanted to figure out which of the forecasts services was making the most accurate forecasts.

The way I calculated this was by comparing the temperature predicted in x days time with the actual temperature reported by the service. e.g. if the provider predicted on 1st/Aug that the temperature would be x degrees in 5 days time, then I compare this with their actual reported temperature on 6th/Aug, This absolute error is then averaged across all readings from  all cities

Here is the summary data

Here is a chart of the data for people who prefer visual:

Points to note
  • I eliminated one reading from weather underground 6 day forecasts because it would have re-scaled the chart (probably indicates a programming error on my behalf).
  • In general the forecast accuracy decreases as the number of days increases.
  • Yr.no is best for next day, but bluemix and darksky are equally good further out.
  • OpenWeatherMap and Weather underground are significantly worse.

This analysis lumps all cities together for an average result. I might do some analysis later on performance per city.

Weather forecast data


I have published several posts about weather. I also did articles with analysis of temperature and wind forecast, but there is a lot more analysis which could be done. Therefore I decided to publish the raw data in case anyone wants to analyse it. I will also do some more charting/plotting myself.

Click here to download the captured forecasts in CSV format. The file contains over 2 million records in total and the format is fairly self explanatory. It covers a period from June 2017 to December 2018, but some forecasts are missing due to a variety of factors. Most notably the Bluemix data only covers August 2017 to February 2018.

I will later post additional analysis files in this folder with some derived data from this original data in the CSV.

I recently found out about a professional analysis report comparing the accuracy of several forecast providers. I think you should value their results above mine.


Thursday, January 11, 2018

My new GlowOrb tells me when rain is imminent

I recently acquired a new gadget called a GlowOrb. This is an orb the size of a ping-pong ball which is MQTT enabled which means that it can be programmed to change colour to give an ambient indication of some metric you would like to be aware of. Previous owners have used their GlowOrbs for a wide variety of uses e.g. alerting on air quality changes. However, I am obsessed with rain (as are almost all Irish people) so I decided to configure my GlowOrb to alert me of the chances of rain in the immediate future.

I followed the colour scheme from official weather warnings. So if my GlowOrb is
  • Green (as in the picture) it means that there is < 20% chance that it will rain in the next 4 hours and I can cycle to work with confidence that I won't be like a drowned rat when I get there.
  • Yellow tells me that the chance of rain is between 20% and 40% so bringing a jacket might be a good precaution
  • Orange indicates that the probability has grown to 40% - 60%
  • Red implies that the chance of rain is over  60% so there is no point in putting out the washing.
The way it works is that each GlowOrb has a serial number (printed on the underside of the unit) and you send a MQTT message containing a colour code to a MQTT channel associate with the serial number to change the colour of your orb. Don't worry if you don't understand what this means, there is a web address like http://mqtt.org/GO/XXXX-YYYY/ printed on the base of the unit (where XXXX-YYYY is the serial number of your unit) and if you visit this web address you will be given detailed instructions on how to use the GlowOrb. It also gives you a piece of JSON that you can import into any NodeRed service to have a working control program for your GlowOrb.

All I had to do to customise my GlowOrb was to write a simple NodeRed flow which accesses the BlueMix weather service every 15 minutes to determine the likelihood of rain where I live and then change the colour of the GlowOrb to match.

If you can imagine a use for your own GlowOrb, I encourage you to get one and experiment. They are quite cheap, but there is no formal ordering or pricing process for GlowOrbs. However, if you send a twitter message to @AndySc, he will give you a price quote in bitcoin or pound sterling.

Sunday, November 12, 2017

The life and death of the @llweather weather station


It seems that my personal weather station is going to be off line for several months (or maybe forever), so I thought I ought to write a short blog post to explain the history of the station and why I have to take it off line. It is a good example of how much work can be involved in keeping a service running despite the fact that the service is supposed to be completely automatic.

Here is the history:
  • My story started during the cold winter of  2010 in Ireland. The weather was so severe that this cold snap has it's own wikipedia page. As a result, I became very interested in weather and I dropped a strong hint that I wanted a weather station kit from Maplin as my Christmas present.
  • This kit included some software to upload my weather data to the internet. This seemed like a cool idea to me, but the software only worked on Windows and I didn't like the idea of leaving a windows PC running 24/7.
  • I used Google to look if there was other software I could use and found several open source options. Eventually I picked a python library pywws and I staredt publishing to my personal weather underground site in March 2011 with a Tonido Plug  (an Ubuntu Linux based plug computer) doing the hard work.
  • In April/May 2015 my plug computer died a natural death due to overheating. Instead of buying a new plug I replaced it with a Raspberry Pi because that had been released in the meantime and it was the new cool thing to use for hobby projects (it was also smaller and cheaper than a new Tonido plug).
  • As part of setting up the Raspberry Pi, I downloaded a new version of pywws. I noticed that  it now had support for uploading to a number of new services including Twitter and so I established the @llweather account to store my tweets. 
  • I though other geeks might be interested in what I did an so I spoke at 3Dcamp Limerick in May 2015  At this talk, an audience member warned me  that I was lucky to have a station still working because the normal lifespan is 2-3 years. This prediction was proven true when shortly afterwards the indoor weather hub smashed to pieces in an accident Apparently it is normally the outdoor equipment that dies due to the severity of the weather it is monitoring, but due to my own clumsiness my home office was a more severe environment than any Irish storm. It wasn't possible to buy a new hub unit so I bought a completely new kit. Luckily my old software configuration worked fine with the new hardware and service was quickly restored.
  • The software was completely automatic, but I found that sometimes my site stopped sending updates and although it was normally easy to fix the problem, it took me some time to notice that there was an issue. Therefore I implemented a monitoring service based upon tweets or lack of same. Since my employer IBM had recently launched the Bluemix service I implemented this in NodeRed running on Bluemix.
  • The monitoring software would send me a Twitter DM whenever it noticed that the weather station had stopped sending tweets or if it started sending blank tweets. There were several possible causes but I noticed that they were normally solved by tightening the USB cable and/or rebooting the Raspberry Pi. After a while I stopped investigating the cause and just tried simple solution. I only investigated the issue when this failed to solve the issue.
  • In early 2017, the station started warning much more often often. Since these problems often solved themselves, I loosened the rules about when to issue a warning (e.g. 40 minutes without a tweet instead of 25 and ignore the first 2 blank tweets). However. the problem got even worse and I couldn't ignore it anymore. I suspected that the raspberry pi was at fault because it was getting old, but a new replacement was not significantly better. I eventually thought to replace the power supply and problem went away for 1 month.
  • When I investigated. I noticed that the indoor hub was getting either no data or crazy data e.g. 51 degrees centigrade in Ireland. If this was Dubai it could mean hot weather, but in Dublin could only mean equipment malfunction. A quick Google said it was most likely a problem with dampness in transmitter unit. When I disassembled the unit there was indeed signs of water damage. Unfortunately, the recommended solution of leaving it in the hot press for a few days didn't solve the problem so I decided to buy a replacement transmitter.
  • The only supplier of spares is Maplin (or amazon/ebay) but all said that they were sold out. I then went to local Maplin store and they said none anywhere in Ireland. 5 available in English Maplin stores but they couldn't tell which store and it might be a computer error. Their web store won't have any in stock until Feb 2018 and I couldn't place an order now even if I was willing to wait
  • The Maplin guy said that it might be possible to buy a spare from another supplier, but he couldn't tell me which brands were compatible with Maplin N96GY. I found some websites selling sparese for the Nevada WH1080PC weather statio which is allegedly co,patible, but when I found one online their picture looked slightl different to mine so I was reluctant to buy

I eventually decided to retire the station for now and reconsider in Feb if I buy a spare when they become available. Overall I must admit I was surprised at how much work was involved in keeping a relatively simple service online.

Wednesday, March 15, 2017

Personalised weather warnings

One of the benefits of having a personal weather station in your back garden is that you should know about local bad weather events quite quickly after they happen. However, the reality is that I don't constantly check the weather data published by my station, so I decided to implement a personal alert system driven off the data.

The obvious protocol for such an alert system is MQTT. However, the MQTT interface module  of the pywws software that I am using to manage my weather station doesn't seem to want to upload any data. After spending time debugging Python (confirming my dislike of the language), I gave up and decided to pursue an alternative strategy based upon the Twitter updates from the station. I implemented a NodeRed  flow on the IBM BlueMix service which monitored the twitter feed and took various actions depending upon what it saw.

The warning rules I decided to implement were:
  • The station is supposed to tweet a weather status every 10 minutes. If 15 minutes or more have passed since the last tweet something has malfunctioned, so the weather station twitter account (@llweather) sends a direct message to my personal account (@bodonovan).
  • When it starts to rain (an all too frequent event in Ireland), the weather station sends me an @reply message to advise me to bring in any washing hanging on the line.
  • The dashboard in my car warns of possible icy roads when the temperature drops below 3 degrees centigrade. Therefore I decided to get my weather station to also send me an @reply message when this happens (luckily this alert gets triggered less frequently in Ireland, but if I moved to Alaska I would need to tweak the threshold).
  • I don't want to be annoyed by repeated tweets about the same weather event, so I put in some code that alerts of the same type won't be repeated more often than once every 6 hours. 
  • The application is configured not to send any warnings between midnight and 7am. I am interested in weather, but not interested enough to lose sleep over it.
It is quite unusual for the temperature in Ireland to drop below 3 degrees at this time of year. Rather than wait for several months to find out if the temperature warning was working I temporarily set the limit to 10 degrees and this is an example of what I got:
Unfortunately, I didn't have to wait too long to get a real rain warning e.g.:

At some stage in the future I will put some more effort into fixing the MQTT problems (partly as a way to learn Python better). But, for now the system seems to be working fine.

Monday, February 13, 2017

My Personal Weather Station comes back on line

Back in March 2011I set up a personal weather station reporting to Weather Underground. Thus continued to report until September 2014 when the hardware I was using died. I recently acquired  replacement hardware and I now have my site on Weather Underground up and working with data being updated every 10 minutes. I am now using a Raspberry Pi rather than a Tonido plug which I was using last time. But, this useful guide on how to get working on a Raspberry Pi helped make it very easy.

I am still using the pywws library, but I am glad to report that it has become even better since the last time.  Using the new functionality, the site is also twittering regularly and also send updates to the UK Met Office and OpenWeatherMap. The software also supports a number of more obscure web sites so it is really easy to widely share the data being collected.

When I first set up the weather station, there were around 4 or 5 stations reporting from Dublin. However, when I checked recently I see that the number of stations reporting from Dublin has grown to over 50 (possibly helped by the fact that Maplin are selling the hardware in kit form quite cheaply).

Previously I could claim to be the only wunderground weather station in Castleknock, but now there are 4 quite close to me. One is about 750 meters south west of me. Another is 1km east of me, while a fourth station is about 1km further east. When I have sufficient data collected I might do a little analysis about how close are the data point reported by the 4 stations in almost the same place.

Last time I mounted the sensors on the boundary wall. Unfortunately this meant that the wind sensors were blocked by overgrown vegetation in neighbouring gardens. This time I decided the put the hardware on the side of shed where I hope it is less likely to become entagngled.

Tuesday, January 10, 2017

How accurate are wind forecasts for Dublin?

In my last post I analysed temperature forecasts for Dublin and today I will turn my attention to wind.

At first glance, the wind readings seemed less consistent with each other than the temperature readings. In particular, the readings from OpenWeatherMap and WeatherUnderground (WU) were consistently lower than the others. However, when I investigated, I found:
  1. I had been interpreting the readings from OpenWeatherMap as kilometres per hour while in fact they were in meters per second. Once I corrected this error, their readings lined up well with other services.
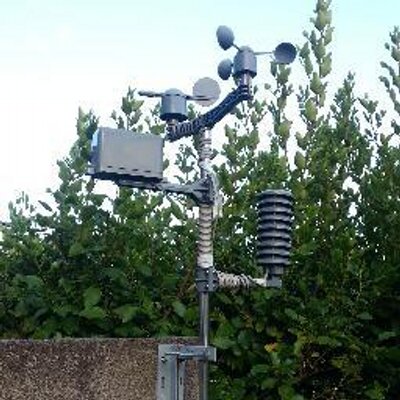
  2. There was no similar simple explanation for the wind speed readings from WU not matching the other services. It was just a problem with their actual data from Dublin - the forecast data for Dublin and the actual readings from other cities lined up with other services. Since weather underground is built upon data from amateur weather stations, I suspect that the weather station they were using for wind speed readings from Dublin was badly positioned e.g. see  the picture of a weather station of mine which used to report to WU before it broke - initially the readings were reasonable, but then the neighbour's hedge grew taller and began to block wind from reaching the station. As a result, I chose to exclude the WU from the calculation of averages and to compare the WU forecasts with the actual reading from other stations rather than their own readings.
The raw data about wind forecasts is available here and a summary table is given below.

ProviderDecimal PlacesAve ErrFcst1 ErrFcst3 ErrFcst7 Err
weatheronline04.306.137.37
openweathermap24.3010.2211.10
weatherunderground115.834.194.026.04
darksky24.893.314.647.07
BlueMix04.284.675.378.07
yr.no25.973.624.317.97
Average excl WU4.755.596.567.70
Average incl WU6.595.366.137.29

A few observations about this table:

  • In general, the accuracy of the wind forecasts is worse than the accuracy of the temperature forecasts. Although you can't compare Celsius readings with km/h readings, if I transformed the data into % error the same conclusion would be reached. This is probably a reflection of the fact that the wind speed in Dublin varies more from day to day than the temperature.
  • On balance DarkSky is probably the overall winner for accuracy, but BlueMix and yr.no are both very close.
  • Surprisingly the wind forecasts from weather underground are almost as accurate as the best services, but their historical reports are so inaccurate that they could not be considered good.
  • In contrast, the wind forecasts from open weather map are noticeably worse than the other services (and weather online is not much better).

While I was writing this post, I found out about an organisation called Forecast Watch who did a much more detailed analysis of weather forecast accuracy. You can read their conclusions here but the quick summary is that most years the winner for the most accurate forecasts was The Weather Channel (which is now an IBM subsidiary and I refer to a BlueMix), but in a few cases the winner was the Weather Underground (also an IBM company) or MeteoGroup (which was not one of the services I analysed). They analysed forecasts for several cities and they found that the best performing service varies significantly from city to city.

Thursday, December 29, 2016

How accurate are temperature forecasts for Dublin

I got a very positive reaction to my presentation about my weather forecast tracking application on Bluemix. Most people who saw this presentation asked which weather forecast service was best. Unfortunately I had to reply to them that I didn't know because I had only just built the app and never used it yet to do any detailed analysis. This post is an attempt start rectifying that error by looking at the accuracy of the various services for forecasting temperature in Dublin over the last month.

At the innovation showcase event a number of people spoke highly of  the Norwegian forecast service yr.no and claimed that it was the most accurate in their experience. Therefore, I decided to add this service into my data collection service (it is a testament to the flexible architecture that this was a relatively easy task) and wait until a month had passed before beginning analysis so that we had  enough data from them to compare.

I chose to initially analyse data from Dublin since this is where I live. I analysed temperature readings and forecasts for the period from 22nd of November to 21st of December 2016. I looked at the actual weather reported as well as the forecast for next day and the forecast for 3 days time. Some of the services offered forecasts for further into the future, but I chose to pick the 3 day forecast because this was supported by all services. If you want, you can see the actual data here.

The thing that most people commented upon at the innovation showcase was the fact that actual temperature data reported by each service did not match up exactly. When I analysed this, I noticed that some of this difference was down to data rounding. The temperature data reported by OpenWeatherMap  and DarkSky is given in celcius with 2 decimal places, in contrast WeatherUnderground and yr.no only give a single decimal place and both WeatherOnline and the BlueMix weather data are reported in whole numbers.

People asked me which service was actually correct, but the truth is that I have no way to tell. What I decided to do was to compute the average of the temperature reported by all services and then comparing the number reported by each service to this average. As you can see from the table below, the average error was actually quite small - not much more  than the average of 0.25 degrees which would be expected from rounding error. Interestingly, the yr.no service has the greatest level of difference from the average.

For assessing the forecasts I looked at the difference between the temperature that was forecast 1 or 3 days earlier and the actual temperature reported on the date in question. I also looked at the forecasts for one week ahead, although this could only be done for 4 of the 6 services since WeatherOnline and OpenWeatherMap don't supply 1 week forecasts.

The average level of error was slightly higher for 3 days in advance  (1.74 degrees) than it was for 1 day in advance (1.41 degrees) and higher again (1.95 degrees) for 7 day forecasts. The most accurate forecasts were from the BlueMix weather service across all 3 timespans. The second most accurate 1 daya forecasts were from the yr.no service although the 3 day and 7 forecasts from yr.no were definitely worse - the 7 day forecasts from yr.no were the worst of all services..


-->
ProviderDecimal PlacesAve ErrFcst1 ErrFcst3 ErrFcst7 Err
weatheronline00.391.201.37
openweathermap20.371.932.21
weatherunderground10.581.962.012.30
darksky20.521.591.791.30
BlueMix00.520.800.801.30
yr.no10.750.962.282.90
Average0.521.411.741.95

-->

Overall, I think the conclusion is that the temperature forecasts are actually quite close to the  actual values, but the details might vary if I looked at a longer time period and/or more cities.

In reality temperature forecasts are relatively easy since temperature doesn't vary widely from day to day in this part of the world. Next I will look at wind speed forecasts since these might be more variable and also because I have been told that they are closely watched by insurance companies since wind speed correlates with weather damage,


-->-->

Tuesday, November 8, 2016

My weather forecast tracking project.on BlueMix

In Ireland people are obsessed about the accuracy (or otherwise) of weather forecasts. This is why I previously did a small project to compare the accuracy of a three different online weather forecast services for Ireland. This project was limited and, only looked at Ireland over a short time period. However, because the way I collected data was only partially automated, it was impractical to extend it without a radical change.

IBM has recently launched the BlueMix cloud platform with lots of cool features which make it ideal to do what I wanted i.e. collect, store and process weather data. Therefore I decided to re-implement my earlier idea with a much wider scope.

There are lots of services available on the internet for current weather data and forecasts. As I mentioned before, there are even some which offer historic weather data, but none which offer access to historic forecasts - i.e. they will tell you what they predict tomorrow's weather is going to be, but they won't tell you what they predicted yesterday for today's weather. Therefore I need to collect and store the weather forecasts so I can later analyse them.

There are so many different services offering weather forecasts on the internet that it was hard to decide which ones to use. I picked the services to use mainly based upon the ease of use of their API:
I started by collecting data for cities with which I had some association, but this collection didn't cover the globe very well. So I then added in a few random cities which increased my geographic and climate type distribution. (e.g. Antarctica covered an extreme in both directions).

The current list of cities monitored are:
  • Antarctica (not really a city, but I picked a point beside the south pole).
  • Canterbury, New Zealand
  • Cape Town, South Africa
  • Coral Springs, Florida, USA
  • Clemmons, North Carolina, USA
  • Dublin, Ireland
  • Galway, Ireland
  • Honolulu, Hawaii, USA
  • Isle of Wight, UK
  • Lanzarote, Canary Islands, Spain
  • Luxor, Egypt
  • Perth, Western Australia
  • Rio de Janeiro, Brazil
I know that most of these services update their forecasts several times a day, but I decided to make things simple by collecting weather data and forecasts once a day at midday. Working out midday in local time would be complex, especially since some of the cities implement daylight savings time at different times of the year and in different directions. Instead I decided to use the concept of solar midday - i.e. the time when the sun is highest at the city. This had the advantage of spreading out the sampling so that the system is not overloaded by taking many samples at the same time - e.g. the Isle of Wight has a solar midday at 5 minutes past 12 UTC, while Lanzarote has a solar midday of 54 minutes past 12 UTC despite the fact that the two locations use the exact same local time.

All of the weather services I used allow me to specify the latitude and longitude of where I want data or a forecast for. For larger cities I have a reasonably wide choice of where exactly within the city boundary I specify. However, the services don't have enough weather stations to provide coverage of everywhere. When I request data about a specific location the services will instead return information about the closest location that they have information about. This possibly explains some of the differenced between the services.

I added Antarctica to the list of cities so that I would have an extremely cold climate to compare with warmer locations like Luxor, Egypt. In fact, Antarctica  is not a city as such: there are no cities in such an inhospitable place. Unsurprisingly, not all of the weather services provide data or forecasts for Antarctica. Only OpenWeatherMap and DarkSky provide weather reports for Antarctica, but surprisingly BlueMix does also provide forecasts for here.

Technology Overview

As a computer geek, I am naturally most interested in the inner workings of how the data gets collected and processed. Therefore I decided to include a brief overview here, with the detail saved for a later post. However, if you are only interested in weather then jump to the next section which describes how to access the data.
  • As I mentioned, the project used the Bluemix platform. More specifically, I used the "Internet-of-Things (IOT) template" which provided me with the Node-Red programming environment and a Cloudant NoSQL database service to store my data. This was my first significant application to develop with Node-Red, but I had no problems getting to grips to this programming environment. It was also my first significant use of a NoSQL database. I created a database for the forecasts, but I also created additional ones to store logs of the various steps in the process.  Putting data into the database was really easy, but getting it back out again was not so easy - on a few occasions I was tempted to use a traditional SQL database.
  • All of the weather services report the weather data in different formats and so I needed to extract the data into a common format so they could be compared. This inevitably meant that I needed to discard some interesting information which is only supplied by one service. An example of the type of record I store is shown below:
    {
      "provider": "darksky",
      "request_date": "2016-11-01T00:32:00.980Z",
      "city": "Canterbury",
      "days_in_advance": 7,
      "temp_max": 18.26,
      "temp_min": 7.54,
      "temp": 18.26,
      "pressure": 997.09,
      "humidity": 68,
      "wind_speed": 11.62,
      "rain": true,
      "forecast_date": "2016-11-08T00:32:00.980Z"
    }
    
    The sample shown is a forecast from the darksky service for the city of Canterbury, New Zealand. The forecasts was retrieved shortly after midnight GMT (which is close to midday locally) on the 1st of November, Since the forecasts is for 7 days in advance, it is a prediction of what weather would be like on 8th of November. Most of the fields are self explanatory, but it should be noted that the precision is different from service to service. DarkSky gives 2 decimal places of accuracy for its temperature prediction while most give only 1 decimal place or even round them to the nearest degree centigrade. The value "rain": true implies that they predicted it would be raining on 8th of November. However, the value of the rain field currently comes with a serious health warning because I don't have a good grasp of the different ways that the various services report on rain. This will be improved in the future.
  • The example I gave is of a forecast. A historical weather reading is similar with the only difference being that it won't contain days_in_advance or forecast_date fields.
  • Most of the effort went into collecting the data, but I also needed to provide a way to get the data back out again. I implemented a simple web page (described below) which contains a Google chart widget and some buttons to control what data is displayed on the chart. In addition to this web page (accessed by the /ui url) I also needed to implement 2 other urls. The /data url is a service that gets called by the /ui page which returns raw weather data in JSON format. In addition I implemented the /check url which counts the number of weather reports and forecasts which have been retrieved today for each city. This url is used by a simple script that executes on a machine running on the Amazon cloud which sends me an email if the count doesn't match what is expected. I thought it was important to have this running outside of BlueMix because it is better not to have a service monitoring itself.

How to Access the Data

The simple instruction is to go to http://bodonovan.mybluemix.net/ui and if
 I did a reasonable job you should be able to figure it out yourself. So just go ahead and try it, the description here is just in case you get stuck.

The bulk of the page comprises a google chart widget with a line chart for what data you have chosen.  Below it there are a number of controls to select data for charting.

  • You must specify the date range you want to chart by means of a to and from date fields. If you view the page in Google Chrome or Internet Explorer browser, these fields will have a fancy date picker associated with them, but if you use Firefox they act like simple text entry fields. You can specify dates as far back as August 2016 which is when I started collecting data, but the data is very patchy before October 2016 when I implemented the full range of providers and cities.
  • There are drop downs to specify which provider you want data from, what city you are interested in and what feature you want t o chart. The features supported are temperature, pressure, humidity, wind speed and wind direction.In the future, I hope to support rainfall, but this is not working yet because of the different ways that the different services report rainfall. You also have an option to select actual data or forecasts. If you select forecasts, you also must specify how many days in advance you want the forecast for (not all service providers provide forecasts as many days in advance)
  • When you have made all of the selections, you can click on the "load data" button to add the relevant line to the chart. You can then change your selections and add more lines to compare anything you want. For example you might want to compare actual data for your city to what the forecast was 1/5/7 days in advance. You can also compare what the different providers are forecasting to see if there is consensus - or you can compare the actual data they report to see if they even agree on this. You can even go crazy and compare temperature in one city with pressure in another city, but comparing different feature is unlikely to be satisfactory because I don't support rescaling the different measurement scales.
  • If the database is missing data about some of the days you requested, it will draw a line with gaps. However, if select something which we have no data about (e.g. asking for a 7 day forecast from a service which only supports 5 days) you with get a "no data" warning.
  • With so many possibilities it is inevitable that you will make some mistakes. Therefore there is a "remove data" button to remove the most recently added line from the chart. There is also a "clear chart" button which removed all lines from the chart.
  • When you have interesting data displayed, there is an "export data" button which allows you to export the displayed readings to a CSV file so you can analyse them further with other tools.

Future work

  • The UI for accessing the data is very basic so I intend to implement an improved UI soon.
  • The check service regularly informs me that certain services have failed to report data for a particular city, but I have no idea why. If I implement better error tracking and logging I should be able to reduce the error rate.
  • From an Irish perspective, one of the most important weather features is rain. Therefore, I intend to improve the way rain data and forecasts are handled.
  • I reckon that there is a reasonably wide spread of cities and weather forecast services supported, but I will add more if there is a demand.
  • Last, but not least, I hope to get some real users so I can learn how the service can be useful.

Wednesday, September 3, 2014

What is the Strange Weather Hackathon?

The Science Gallery is currently hosting a weather themed hackathon in conjunction with their Strange Weather exhibition. The general idea is that teams will spend two days trying to do their best to answer a challenge related to how we deal with climate change.

For example, I am part of the "Woodville" team and we are trying to answer the challenge "What should I plant so that it will be suited to the expected future climate in my part of the world?". We are leveraging predictions for the likely effects of global warming which means that people will need to plant different crops than were traditionally planted in their area. Our team discussion document is hosted on hackpad. You can click here to see the latest version of the app on our web site (hopefully it will be working by tomorrow evening)..

Saturday, August 30, 2014

My Weather Station comes back on-line

My old weather station equipment suffered damage and so no data has been reported for the last few months. Luckily I got a birthday present of a new weather station and so my weather site is back online again. Unfortunately the twitter feed is not being updated, but I will fix that soon.

As I was setting up the new station I realised that the clock on my Tonido plug was seriously wrong. For some reason the date skipped forward from 2nd of December 2013 to 16th of April  2030. This means that the forecast data I have been collecting was incorrectly dated. When I get a chance I will write a script to fix up all of the data.

Thursday, May 16, 2013

Draft slides for @3dcamp

Here is the first draft of the slides for my proposed talk at 3D camp in Limerick the weekend after next. Feedback and comments are welcome.

Friday, May 10, 2013

Tweeting about local weather conditions

I am quite proud of my personal weather station and the fact that it automatically makes reports available through a dedicated page on the Weather Underground site. However, until recently I was embarrassed to admit that the weather station didn't have its own twitter feed. Yesterday, I rectified this situation and I can now boast to my fellow geeks that the station is Tweeting hourly weather reports as @LLweather which is a new Twitter account I created for the weather station. In fact it is one of a large network of private weather stations in Ireland tweeting weather reports with the #iwn hashtag - this should not be surprising because most Irish people are obsessed by weather.

Initially I tried to write a short python script to do the updates, but then I discovered that this feature was already supported by the PYWWS package that I was using to upload the data to Weather underground. There were even clear instructions available on how to configure the software on their web site (I had to upgrade to v12.10 to get it to work).

After I set it up I was surprised to notice that the weather station was apparently giving weather reports about 20-25 minutes into the future. When I investigated I found that the clock on my Tonido plug was running alarmingly fast. I tried to set up the NTP deamon to keep the clock synchronised, but this proved complicated because the plug is running a very old version of Ubuntu. I corrected the time manually and will keep an eye on it until I get around to configuring NTP properly.


Sunday, March 25, 2012

"Dunboyne Fun Run" lives up to its name

Today I entered the Dunboyne Fun Run on a whim, because I was out in Dunboyne anyway dropping off my daughter who was participating in the junior run. I must say that the organisers did a splendid job - the last-minute registration process was very smooth, the large field of runners was well marshalled and everyone enjoyed a run in atypically glorious sunshine.

I was pleased with my time -37 minutes and 6 seconds for a 4 mile route.

After the race was over there was even a bonus of a magnificent free spread of cakes and tea for all participants in the local community centre. They even had a band playing live traditional music. Definitely a day to be happy I live in Ireland.

Saturday, March 24, 2012

Gathering of amateur and professional weather fans shows Dublin City of Science 2012 at its best

Today I spent a really fun day attending a conference entitled "The Science of Weather Forecasting" which was organised by the Irish Met Society. The talks were very interesting and educational, but what was really enjoyable was that during the breaks I got to chat with several enthusiastic amateur weather fans. It was an added bonus that the event was held in the beautiful Botanic Gardens and the day was one of the few Irish days with unbroken sunshine.

I suppose that all Irish people are interested in collecting weather data. The most common conversation opener for phone conversations in Ireland is "what is the weather like where you are?". Now that professional quality weather monitoring equipment has become available and affordable, we can now turn these informal weather observations into proper scientific measurements which can be used to improve forecasting. I met several people who had their own weather stations in their back gardens like me. I also found out that there is even a site dedicated to collecting this data from Irish amateur weather monitoring stations. I plan to connect my existing monitoring station to this site within the next few days.

This is an excellent example of the type of event which is being organised as part of Dublin City of Science 2012. It encouraged my existing interest in meteorology and I promptly joined the Irish Met Society and I have every intention of being an active member.

Wednesday, November 30, 2011

Are the weather forecasts in Ireland really as bad as people complain?

The weather in Ireland is notoriously changeable. As a result of this the common perceptions is that the professional weather forecasters often fail to accurately predict the weather even a few days into the future. However, it is hard to find definitive data about how accurate or not the weather forecasts are.

A quick search of the Internet will reveal several sites giving confident predictions for what the weather will be in the future and/or listing what the weather was at various dates in the past. However, very few of them reveal what their past predictions were and so it is difficult to find an objective measure for how much confidence you should place in a particular forecast.

I thought this would make a very interesting project for the BT Young Scientist competition for my daughter and a few of her friends. Unfortunately the judges did not agree and they rejected their entry into the competition. However, in anticipation of their project being accepted, I created a simple batch job that fetched weather forecasts from three different Internet sites each day and saved them in files for later analysis. Since the data was being collected anyway, I thought it would be a shame not to do anything with it and so I decided to a short bit of analysis which I write up here. If you don't want to bother reading all of the blog post the short summary is that the forecasts are indeed not very accurate.

When choosing the sites to use I was more influenced by how easy the data was to collect than by whether or not the source was authoritative. For example, the Met Éireann are the official forecasting service of the Irish Government, but their forecasts are deliberately translated from numerical predictions into a forecast that humans can easily understand e.g. "rain will spread from the west and become heavy by nightfall". It is very hard to do any statistical analysis on forecasts like that, so I deliberately chose three services which provided numerical forecasts in a format that was easy to parse:
  1. The Yahoo weather service is widely used. By fetching the contents of this URL each day I was able to retrieve an XML file with details of current weather conditions in Dublin, Ireland as well as their forecast for the weather the next 2 days.
  2. Weather.com is the weather service provided by the well known Weather channel and it provides weather data and predictions for all parts of the globe. By fetching this URL I got an XML file with their current weather data for Dublin as well as a prediction for the next 4 days.
  3. WeatherOnline is not quite so well known a weather prediction site, but they make their data very easy to retrieve. By fetching this URL, I was able to get a CSV formatted file with current weather conditions in Dublin and a forecast for the next 5 days.
I have collected about 2 months worth of data at this stage. Initially I decided to analyse the accuracy of the WeatherOnline data for the practical reason that it was easier to transform CSV files into spreadsheets than to transform XML files.

The first thing I looked at was rainfall predictions. The following chart shows the predicted rainfall (on the Y-Axis in millimetres) plotted against the actual observed rainfall (on the X-Axis). If the forecast was perfect all the dots would be on a straight line with a 45 degree slope. I don't think that anyone would expect the forecast to be perfect, but I must admit that I was personally surprised at how poor this forecast is. I calculated the correlation coefficient between  the forecast and actual data and it came out at 0.28 - the general rule of thumb would be to interpret such a low correlation figure as "there may be some small association between the figures". If I looked at the prediction from 5 days before rather than the prediction from the day before the correlation coefficient goes down to 0.07 - this is normally interpreted to mean that there is no association between the prediction and actual values.
Rainfall Prediction v Actual (mm)

The next parameter I looked at was temperature. The following chart show the actual temperature plotted against the predicted temperature from the day before and from 5 days before.

I think you would agree that the temperature predictions seem to be a little better than the rain predictions and this next chart shows the predicted temperature readings from the day before (in degrees Celsius on the Y-Axis)  plotted against the actual temperature on the X-Axis. This is not the straight 45 degree line we would hope for, but at least there is some association between the two. Indeed the correlation coefficient is 0.33 which is jut high enough to indicate that there is a medium strength correlation.
Predicted Temp v Actual Temp
However, the team at WeatherOnline should not be too proud of this result because the temperature in Ireland does not swing very much from day to day so it should be easy to predict. The average error in their temperature prediction was 2.66 degrees.  I am sure that they use a very sophisticated prediction methodology, but if instead they simply predicted that the temperature tomorrow will be the same as today, their average error would only increase to 2.76 degrees.

I have only scratched the surface of this topic. If the girls' project had been accepted they would probably have done a much more extensive analysis. Areas that would be interesting to tackle would be:
  • Analysing the other factors of the prediction e.g. wind speed and direction, pressure etc.
  • Looking at different weather prediction services to see if some are better than others.
  • Looking at longer time scales. Because of the way I am collecting the data it is not possible to go back into the past and collect historical data, but if anyone knows of a data source showing old weather predictions I would love to analyse this.
  • Looking at similar prediction accuracy in other parts of the world. For example, the weather is an extremely popular topic of conversation among Irish people, but an Egyptian colleague assures me that Egyptian people rarely discuss weather among themselves. I guess a discussion of the weather among Egyptians would quickly become boring since most days are warm and dry. Presumably weather predictions in Egypt are probably more accurate than in Ireland (but maybe nobody bothers to read them).
If anyone wants to learn more about this you can download the raw data here.


Saturday, April 16, 2011

A new Arrival in our Household

People normally use this phrase to announce the birth of a child. I don't love my gadgets as much as I love my children, but the arrival of my latest new gadget is a reasonably big deal.

I wrote before about how I needed to have my weather station constantly attached to a running computer in order to have the collected weather data instantly uploaded to my personal weather site on the internet. Since I don't want to waste power by leaving my desktop PC plugged on all the time, I needed to look for alternative options.


My initial thoughts was that I could use an Arduino device, but an Arduino expert that I met at the Young Scientist advised me that it wouldn't really be up to the task. I then decided to check out one of the new "plug computers". This is a newly emerging form factor for low power computers which look just like a voltage converter (see the picture of my new device beside a pair of sunglasses for comparison.

I looked at a few options on the Internet, before finally settling upon a TonidoPlug, which is an Ubuntu 9.04 based PC which comes complete with a specialised home server package installed upon it (which is optimised for sharing files and other things that you might want to do).

The device was trivially easy to set up. I had my home server up and running in about 5 minutes after opening the package. It took me a little longer to get the weather station installed and configured, but there were no major problems since I am already fairly familiar with Ubuntu, and now my personal weather station is being kept constantly up to date instead of having  to depend upon me remembering to manually upload data.

The device was not completely perfect. I had assumed that it would come with WiFi support but it didn't so I am going to have to leave it close to a network port until I get around to buying a new WiFi card for it. In addition I was hoping that I would be able to attach my 1 TByte USB drive to the Tonidoplug, but it seems that the USB ports don't provide enough power so I am going to have to make do with a 8 GByte USB card for now.